

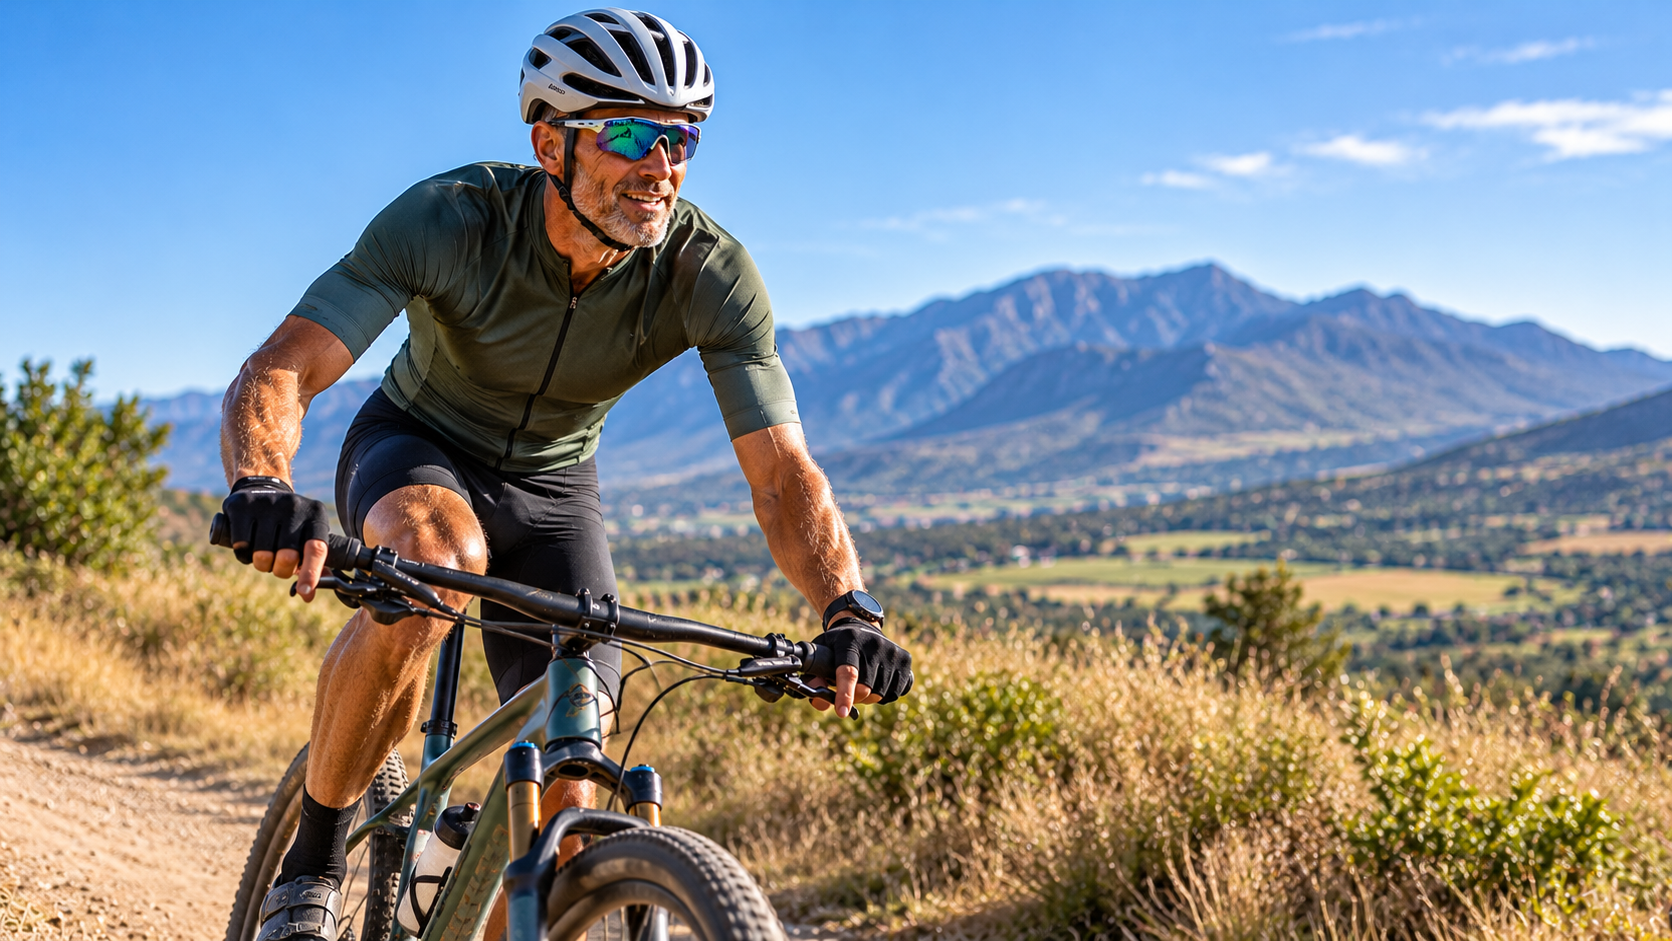
If you had to picture the average South African mountain biker, what would you see? A 35-year-old guy in full race kit, chasing podiums on a carbon dual-suspension bike? A weekend warrior who rides twice a week and enters a few big events each year? Or someone who has been riding for decades, has accumulated a garage full of bikes and now prefers a good trail ride to another full-gas race?
The latest TREAD South African Mountain Biking Survey, presented by Garmin, suggests the third picture might be closer to reality – although the bike in the garage is likely to be rather more expensive and sophisticated than you might expect.
The survey attracted 2 504 respondents, with 2 137 completing all 70 questions. Its findings provide a useful snapshot of the people who make up South Africa’s mountain biking community, their riding habits and their equipment preferences.
So, if we were to build a composite picture of the South African mountain biker in 2026, what would it look like?
Because this article uses tables, turn your mobile device to landscape or view on a laptop/desktop.
He is most likely male – but women make up a meaningful part of the market
| 2025 | 2024 | 2023 | 2022 | 2021 | 2020 | |
|---|---|---|---|---|---|---|
| Female | 21.37% | 20.23% | 24.77% | 17.87% | 20.98% | 19.12% |
| Male | 78.63% | 79.77% | 75.23% | 82.13% | 79.02% | 80.88% |
The survey remains male-dominated, with 78.63% of respondents male and 21.37% female.
That female share is slightly higher than the 20.23% recorded in 2024, although it remains below the 24.77% recorded in 2023. Looking across the six years of comparable results, the female proportion has fluctuated, but has generally remained around one in five respondents.
It is important not to confuse the survey’s respondent profile with a definitive count of all South African mountain bikers. Nevertheless, the female contribution is substantial enough to be commercially and culturally significant. Women are not a peripheral audience for the sport, and brands, event organisers and trail operators should be reflecting that in their products, communication and experiences.
He is probably in his fifties
| 2025 | 2024 | 2023 | 2022 | 2021 | 2020 | |
|---|---|---|---|---|---|---|
| 12-15 years | 3.27% | 2.05% | 1.74% | 1.00% | 1.13% | 0.86% |
| 16-19 years | 4.03% | 3.89% | 3.24% | 2.47% | 1.75% | 1.95% |
| 20-24 years | 2.52% | 3.11% | 3.45% | 2.33% | 2.30% | 2.40% |
| 25-29 years | 2.80% | 4.68% | 5.39% | 4.40% | 3.91% | 5.05% |
| 30-34 years | 5.27% | 6.66% | 5.80% | 7.60% | 7.66% | 7.61% |
| 35-39 years | 7.47% | 11.07% | 11.19% | 12.47% | 12.32% | 13.20% |
| 40-44 years | 12.26% | 14.04% | 13.30% | 14.07% | 17.01% | 16.24% |
| 45-49 years | 12.30% | 13.84% | 15.77% | 16.10% | 17.56% | 18.70% |
| 50-54 years | 16.41% | 14.45% | 14.75% | 15.03% | 15.78% | 15.03% |
| 55-59 years | 14.10% | 11.58% | 10.58% | 11.03% | 10.77% | 10.23% |
| 60-64 years | 9.19% | 7.82% | 8.31% | 8.73% | 5.95% | 5.56% |
| 65-69 years | 6.79% | 4.78% | 4.54% | 3.47% | 2.65% | 2.24% |
| 70 and older | 3.59% | 2.02% | 1.95% | 1.30% | 1.23% | 0.93% |
This is perhaps the most striking part of the profile. The largest single age category in the 2025 survey was 50-54, accounting for 16.41% of respondents. The 55-59 group contributed another 14.10%, while 60-64 accounted for 9.19%.
Combined, respondents aged 50 and older made up 50.08% of the survey. More than one in five were aged 60 or older. This is a significant shift from 2020, when 33.99% of respondents were 50 or older. The 60-plus segment has grown particularly strongly, from 8.73% in 2020 to 22.76% in 2025.
It doesn’t necessarily mean that South Africa’s entire mountain biking population has aged at the same rate. The survey measures its respondents, not every rider in the country. But it does confirm that older riders are an increasingly important part of the market.
He probably lives in Gauteng
| 2025 | 2024 | 2023 | 2022 | 2021 | 2020 | 2019 | |
|---|---|---|---|---|---|---|---|
| Gauteng | 45.61% | 47.56% | 48.03% | 44.67% | 47.66% | 51.18% | 48.90% |
| Western Cape | 25.08% | 30.34% | 32.79% | 38.23% | 32.36% | 27.08% | 27.31% |
| KwaZulu-Natal | 11.38% | 9.02% | 8.51% | 7.73% | 8.86% | 8.50% | 8.29% |
| Mpumalanga | 1.64% | 3.07% | 1.86% | 1.63% | 2.30% | 1.85% | 2.74% |
| Eastern Cape | 3.39% | 2.77% | 3.24% | 2.77% | 3.39% | 5.18% | 4.93% |
| North West | 3.31% | 1.98% | 1.42% | 1.73% | 1.62% | 1.82% | 2.50% |
| Free State | 3.15% | 1.57% | 1.22% | 1.03% | 1.42% | 1.57% | 2.03% |
| Limpopo | 4.39% | 1.13% | 1.50% | 0.67% | 0.74% | 1.02% | 1.02% |
| Northern Cape | 0.28% | 0.72% | 0.36% | 0.37% | 0.58% | 0.54% | 0.63% |
| I live in a neighbouring country | 0.92% | 0.89% | 0.49% | 0.57% | 0.36% | 0.64% | 0.94% |
| I live outside Southern Africa | 0.84% | 0.96% | 0.57% | 0.60% | 0.71% | 0.61% | 0.70% |
Gauteng remains the country’s biggest mountain biking market by survey representation, accounting for 45.61% of respondents in 2025. The Western Cape was second at 25.08%, followed by KwaZulu-Natal at 11.38%. Together, those three provinces accounted for just over 82% of respondents.
The provincial spread is worth noting because it has implications for where brands focus their retail, marketing and event activity. Gauteng is clearly the biggest audience, while the Western Cape remains an important second market. KwaZulu-Natal is a distant third, with the remaining provinces collectively making up a smaller but important share.
He has been riding for a long time
| 2025 | 2024 | 2023 | 2022 | 2021 | 2020 | |
|---|---|---|---|---|---|---|
| One year or less | 2.76% | 6.18% | 4.82% | 3.60% | 3.85% | 6.30% |
| 1-2 years | 5.63% | 6.70% | 7.62% | 6.07% | 6.76% | 7.03% |
| 3-4 years | 11.30% | 12.33% | 13.30% | 8.10% | 7.24% | 8.38% |
| 5-6 years | 9.94% | 12.06% | 13.13% | 11.87% | 13.45% | 13.97% |
| 7-10 years | 15.97% | 16.60% | 16.17% | 24.00% | 26.48% | 27.78% |
| 11-15 years | 18.81% | 18.65% | 18.81% | 21.13% | 22.50% | 17.87% |
| 16-19 years | 12.26% | 7.99% | 8.88% | 11.20% | 9.67% | 8.92% |
| More than 20 years | 23.32% | 19.47% | 17.27% | 14.03% | 10.05% | 9.75% |
The composite rider is not a newcomer. In fact, 23.32% of respondents said they had been mountain biking for more than 20 years – more than double the 9.75% recorded in 2020.
The biggest single experience category was more than 20 years, at 23.32%, followed by 11-15 years at 18.81%. A further 12.26% had been riding for 16-19 years.
This suggests a sizeable core of experienced riders who have remained involved through multiple generations of mountain bikes, changing technology, evolving trail networks and shifting race formats.
There are newcomers, too. The proportion who had been riding for one year or less was 2.76% in 2025, down from 6.18% in 2024. Those who had been riding for three to four years accounted for 11.30%.
The important point is that mountain biking is retaining a substantial number of long-term participants, while still attracting new riders. The challenge is to make sure those newcomers become long-term participants too.
He is more committed than competitive
| 2025 | 2024 | 2023 | 2022 | 2021 | 2020 | 2019 | |
|---|---|---|---|---|---|---|---|
| Very social | 4.83% | 7.11% | 5.51% | 4.40% | 3.04% | 4.38% | 2.50% |
| Recreational | 25.64% | 25.49% | 27.20% | 22.57% | 23.21% | 25.83% | 22.14% |
| Very keen | 42.89% | 41.72% | 43.13% | 48.60% | 51.08% | 47.15% | 51.10% |
| Highly committed | 26.64% | 25.69% | 24.16% | 24.43% | 22.66% | 22.63% | 24.26% |
When asked to describe their level of mountain biking, the biggest group – 42.89% – identified as very keen. Another 26.64% described themselves as highly committed, while 25.64% selected recreational. Only 4.83% considered themselves very social.
That means almost 70% of respondents see themselves as either very keen or highly committed. It is a strong indication that the survey audience is made up largely of people for whom mountain biking is a significant part of their lifestyle, rather than an occasional pastime.
But commitment doesn’t necessarily mean racing every weekend. The most common race frequency was three to six events a year, selected by 42.05% of respondents. A further 38.38% said they raced two or fewer times annually. Just under one in five raced about once a month or more frequently.
This is an important distinction. The average South African mountain biker may be deeply invested in the sport without being a regular competitor. Riding, fitness, social interaction, adventure and time on the trails matter just as much as race results.
His bike is worth almost R100 000
| 2025 | 2024 | 2023 | 2022 | 2021 | 2020 |
|---|---|---|---|---|---|
| R96 783 | R72 439 | R55 763 | R65 450 | R55 000 | R48 971 |
Here’s where the profile becomes particularly interesting for the cycling industry.
The average reported value of the primary mountain bike in the 2025 survey was R96 783. That’s a substantial increase from R72 439 in 2024 and R48 971 in 2020.
The rise is even more revealing when looking at the top end of the market. In 2020, 11.01% of respondents said their bikes cost more than R100 000. By 2025, that had increased to 32.32%. Meanwhile, 13% reported a bike value of R150 000 or more.
That is a remarkable concentration of expensive bicycles among the survey respondents. It also helps explain why the average has climbed so sharply.
The R96 783 figure should be treated as a survey-derived average, not the price of the typical bike bought by the average South African consumer. High-value bikes pull the mean upwards, and the survey audience is likely to be more engaged in cycling than the broader population.
Nevertheless, it confirms that the committed South African mountain biker is prepared to invest significantly in equipment.
Carbon fibre has become the norm
| 2025 | 2024 | 2023 | 2022 | 2021 | 2020 | |
|---|---|---|---|---|---|---|
| Carbon fibre | 63.59% | 57.68% | 59.05% | 55.75% | 52.95% | 47.74% |
| Aluminium | 27.63% | 32.57% | 31.79% | 34.27% | 35.76% | 39.75% |
| Carbon/Alloy combo | 6.69% | 7.27% | 7.07% | 7.65% | 8.63% | 9.52% |
| Other (steel, titanium etc) | 2.09% | 2.47% | 2.09% | 2.33% | 2.66% | 2.99% |
The survey also shows just how far carbon fibre has penetrated the South African mountain bike market.
In 2025, 63.59% of respondents said their primary mountain bike had a carbon-fibre frame. Aluminium accounted for 27.63%, while 6.69% had a carbon/alloy combination. Steel, titanium and other materials made up the remaining 2.09%.
The growth in carbon is significant. In 2020, 47.74% of respondents had carbon frames, while 39.75% had aluminium. Five years later, carbon had increased by almost 16 percentage points and aluminium had fallen by more than 12.
This is not necessarily a reflection of what the average new bike buyer is choosing at retail. It is the material profile of the bikes owned by survey respondents, many of whom are experienced and committed riders. But it does underline the extent to which carbon has become the preferred material among this audience.
| 2025 | 2024 | 2023 | 2022 | 2021 | 2020 | |
|---|---|---|---|---|---|---|
| It’s a hardtail | 15.01% | 18.35% | 19.36% | 19.59% | 21.42% | 24.34% |
| It’s a full-suspension | 73.08% | 70.31% | 68.93% | 69.42% | 66.47% | 63.80% |
| I own both hardtail and full-suspension bikes | 11.91% | 11.34% | 11.71% | 10.99% | 12.11% | 11.86% |
The type of bike is just as revealing. A substantial 73.08% ride full-suspension bikes, compared with 15.01% on hardtails. Another 11.91% own both.
The full-suspension share has increased steadily from 63.80% in 2020. Hardtail ownership has moved in the opposite direction, falling from 24.34% to 15.01%.
And if there’s one specification that is almost universal, it’s wheel size. A massive 91.47% of respondents ride 29-inch wheels. We will be adding 32-inch to the 2026 survey. It will be interesting to see how that trends in the next few years.
SRAM has moved ahead of Shimano
| 2025 | 2024 | 2023 | 2022 | 2021 | 2020 | |
|---|---|---|---|---|---|---|
| SRAM | 49.50% | 45.09% | 42.95% | 43.34% | 39.11% | 36.04% |
| Shimano | 34.03% | 37.19% | 39.82% | 38.02% | 42.06% | 45.40% |
| Shimano/SRAM mix | 15.18% | 15.44% | 15.81% | 17.59% | 17.88% | 17.52% |
| Other | 1.30% | 2.29% | 1.42% | 1.05% | 0.95% | 1.04% |
For many years, Shimano was the default component choice for mountain bikes in South Africa. That has changed.
In 2025, SRAM was the leading component brand, with 49.50% of respondents saying their bikes were predominantly equipped with SRAM components. Shimano accounted for 34.03%, while 15.18% had a mixture of the two.
The shift has been gradual but consistent. In 2020, Shimano led with 45.40%, compared with SRAM’s 36.04%. SRAM moved ahead in 2022 and has extended its lead since then.
| 2025 | 2024 | 2023 | 2022 | 2021 | 2020 | |
|---|---|---|---|---|---|---|
| 1 chainring | 88.92% | 88.12% | 81.81% | 82.31% | 74.87% | 67.99% |
| 2 chainrings | 6.90% | 9.01% | 12.05% | 10.89% | 15.41% | 19.24% |
| 3 chainrings | 4.18% | 4.87% | 6.15% | 6.80% | 9.71% | 12.77% |
The drivetrain has also become considerably simpler. In 2025, 88.92% of respondents had a single-chainring setup. That compares with 67.99% in 2020. Two-chainring drivetrains accounted for just 6.90%, while three-chainring setups had dwindled to 4.18%. It is a clear indication of how quickly modern drivetrain design has filtered through the market, including into more affordable bikes.
When it comes to suspension, RockShox is the most common choice. It accounted for 53.55% of suspension forks, with FOX second at 30.37%. RockShox also moved ahead of FOX in rear shocks, with 45.40% compared with 39.42%.
Shimano remains the leading brake brand, accounting for 50.25% of respondents’ brakesets, while SRAM was second at 38.55%.
| 2025 | 2024 | 2023 | 2022 | 2021 | 2020 | |
|---|---|---|---|---|---|---|
| Maxxis | 59.23% | 57.39% | 58.72% | 59.74% | 57.32% | 57.72% |
| Specialized | 14.13% | 12.11% | 12.84% | 13.02% | 12.93% | 12.38% |
| Vittoria | 8.94% | 8.71% | 8.24% | 8.66% | 9.81% | 9.94% |
| Schwalbe | 7.10% | 6.72% | 6.82% | 6.39% | 6.30% | 4.87% |
| Bontrager | 2.29% | 3.99% | 3.85% | 3.59% | 2.82% | 3.22% |
| Continental | 1.58% | 2.62% | 2.93% | 3.04% | 4.07% | 4.94% |
| Pirelli | 1.42% | 1.37% | 1.21% | 1.05% | 0.69% | 0.29% |
| Kenda | 1.29% | 1.22% | 1.17% | 0.68% | 1.21% | 0.97% |
| Goodyear | 1.25% | 1.11% | 0.67% | 0.27% | – | – |
| Tufo | 0.91% | 1.40% | 0.70% | – | – | – |
| Hutchinson | 0.62% | 0.21% | 0.27% | – | – | – |
| WTB | 0.20% | 0.25% | 0.41% | 0.39% | 0.75% | – |
| CST | 0.16% | 0.13% | 0.17% | 0.33% | 0.45% | – |
| Michelin | 0.16% | 0.08% | 0.30% | 0.33% | 0.45% | – |
| Other | 0.45% | 2.76% | 1.31% | 0.95% | 1.86% | 0.78% |
| Mitas | 0.13% | 0.7% | 0.26% | 0.26% | ||
| Michelin | 0.08% | 0.30% | 0.33% | 0.45% | ||
| Vredestein | 0.08% | 0.27% | 0.23% | 0.42% | ||
| Panaracer | 0.08% | 0.10% | – | – | ||
| Other | 1.31% | 0.95% | 1.86% | 0.78% |
And when it comes to tyres, there is little debate. Maxxis remains the dominant choice by a considerable margin, with 59.23% of respondents naming it as their preferred tyre brand. Specialized was a distant second at 14.13%.
He uses a dropper post – and increasingly an eBike
| 2025 | 2024 | 2023 | 2022 | |
| Yes and I use it all the time | 50.17% | 46.31% | 42.79% | 41.37% |
| No | 37.08% | 42.58% | 46.76% | 50.51% |
| Yes, but I don’t really use it | 12.75% | 11.12% | 10.46% | 8.12% |
The dropper seatpost has become an established part of the modern mountain bike setup. In 2025, 50.17% of respondents said they had a dropper post and used it all the time. Another 12.75% had one but didn’t really use it, while 37.08% still had no dropper.
The proportion using a dropper regularly has increased from 41.37% in 2022. That is a meaningful shift, reflecting how this once-premium feature has become standard equipment on many modern trail and marathon bikes.
Do you own an eBike?
| 2025 | 2024 | 2023 | 2022 | |
|---|---|---|---|---|
| Yes | 17.27% | 13.37% | 12.67% | 9.94% |
| No | 79.68% | 83.75% | 83.40% | 86.36% |
| I plan to buy one soon | 2.34% | 2.36% | 3.14% | 3.21% |
| Other | 0.71% | 0.52% | 0.79% | 0.47% |
eBike ownership is also growing. In 2025, 17.27% of respondents said they owned an eBike, up from 9.94% in 2022. It is still a minority of the survey audience, but the direction is clear.
Gravel bikes are gaining ground too. Ownership increased from 12.18% in 2022 to 21.74% in 2025. That suggests an increasingly multi-bike market, where mountain bikers are adding other bicycles to broaden their riding options rather than necessarily replacing their mountain bikes.
Do you own a gravel bike?
| 2025 | 2024 | 2023 | 2022 | |
|---|---|---|---|---|
| Yes | 21.74% | 18.72% | 16.90% | 12.18% |
| No | 72.58% | 74.85% | 76.54% | 81.94% |
| I plan to buy one soon | 5.69% | 6.43% | 6.57% | 5.89% |
So, what does the average rider look like?
The composite picture is of a male rider in his fifties, most likely living in Gauteng, with more than a decade of mountain biking behind him. He is very keen or highly committed, belongs to a cycling club and probably enters a handful of events each year.
His primary mountain bike is likely to be a full-suspension carbon 29er, with a reported value that could be well into six figures. It probably has SRAM components, a RockShox fork, Maxxis tyres, Shimano brakes, a single-chainring drivetrain and a dropper seatpost.
That is not a precise statistical individual. It is a portrait assembled from the largest categories and most common responses in the survey. It also doesn’t tell us everything we would like to know about the market: the survey results discussed here do not establish a representative average income, household profile or total annual cycling spend.
What they do show is that South African mountain biking has a mature, experienced and highly engaged core. The sport has retained many of the people who discovered it years ago, while schools cycling and other entry points continue to bring younger riders into the picture.
For the industry, the lesson is not to focus exclusively on the older rider or chase youth at the expense of an established market. It is to recognise that the South African mountain biker is not a single stereotype. The sport needs to serve the experienced 60-year-old who still loves a technical trail, the 50-something who enters a stage race, the young XCO racer developing through the schools system and the newcomer discovering mountain biking for the first time.
The average rider might be getting older, but the mountain biking community is broader than that one statistic suggests. And understanding who is actually riding – and what they are riding – is where better decisions about products, events, trails and marketing begin.
Intro image generated by AI (as you can see by the wayward cables)
The 2026 South African Mountain Biking Survey, presented by Garmin will launch later this month.

