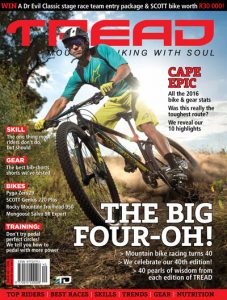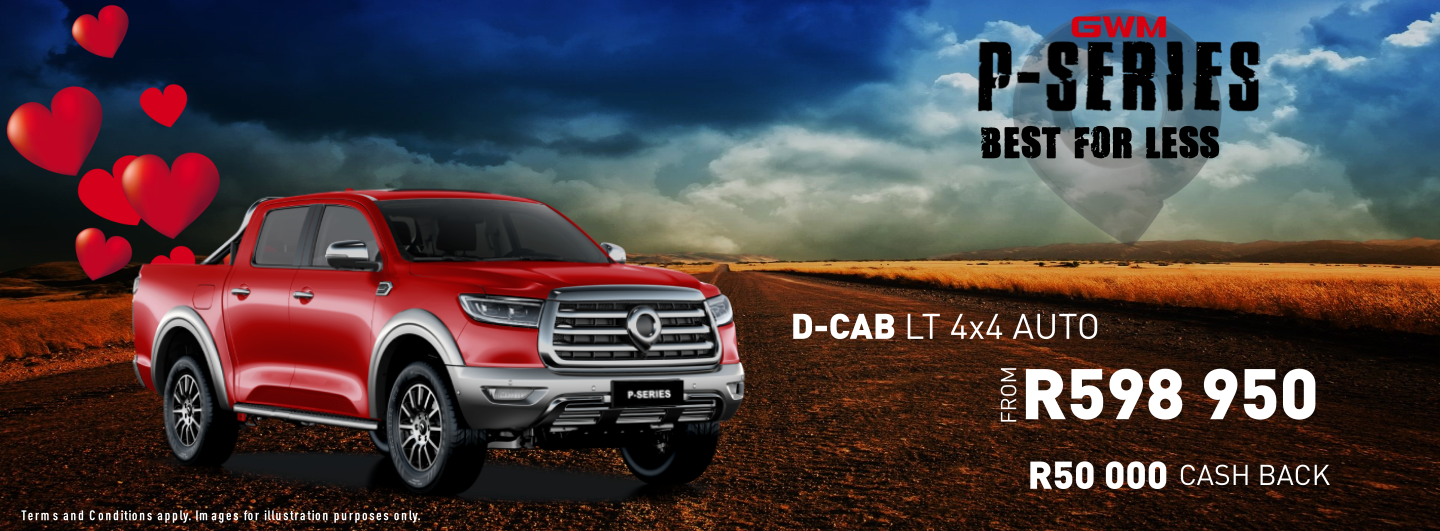
We’ve made a bit a habit out of publishing and analyzing post-Cape Epic statistics. The bike and gear stats are based on feedback from the 1200 participants in the race and provide a good snapshot of what’s currently relevant in the marathon/stage race category.
Normally we don’t add any opinion, but we included some comments after the 2016 event to add perspective or insight. Where stats include previous editions, we get a good perspective on patterns.

BIKE STATS
59% of participants chose to purchase a brand new bike in the 12 months leading up to the 2016 Absa Cape Epic. This is down from the 65% that did so for the 2015 edition.
A total of 80% of participants say their bike cost more than R50 000. This is up from 59% in 2015.
A total of 24% say their bike cost them more than R100 000. The average bike value at the 2016 Cape Epic was R76 051-89.
Average bike value
| 2007 | 2008 | 2009 | 2010 | 2011 |
| R28001 | R30659 | R34215 | R35898 | R37510 |
| R7.27=$1 | R8.19=$1 | R9.72=$1 | R7.39=$1 | R6.84=$1 |
| 2012 | 2013 | 2014 | 2015 | 2016 |
| R40349 | R42244 | R44937 | R60752 | R76052 |
| R7.69=$1 | R9.24=$1 | R10.58=$1 | R12.12=$1 | R14.71=$1 |
We included the Rand=US Dollar rate at 31 March for each year (the Cape Epic month) to add some perspective. Proportionately, in 2016, the Rand was about 100% weaker than it was in 2007, but average bike value had altered more remarkably. It’s worth noting that TREAD Deputy Editor, Dino Lloyd, completed the 2012 Cape Epic on a R12000 aluminium hardtail (read here: Axis A10), confirming that you don’t need to spend a fortune on a bike for the Cape Epic, but if you have the cash, why not?
Most popular bike brands 2015 vs 2016
| 2015 | 2016 | ||
| Specialized | 36% | Specialized | 36% |
| SCOTT | 13% | SCOTT | 12% |
| Cannondale | 9% | Cannondale | 10% |
| Airborne | 4% | Santa Cruz | 5% |
| TREK | 4% | Airborne | 5% |
| Santa Cruz | 4% | TREK | 4% |
| Giant | 4% | Giant | 4% |
| Merida | 3% | BMC | 3% |
| BMC | 3% | Momsen | 3% |
| Rocky Mountain | 2% | Rocky Mountain | 2% |
| Momsen | 2% | Merida | 1% |
Most popular brands history
|
2008 Total |
2008
SA |
2009 Total | 2009
SA |
2010
Total |
2010
SA |
2011
Total |
2011 SA |
|||
| Specialized |
17% |
17% | 18% | 18% | 19% | 19% | 18% |
17% |
||
| SCOTT |
10% |
8% | 12% | 12% | 10% | 8% | 11% |
11% |
||
| Cannondale |
5% |
5% | 6% | 4% | 6% | 4% | 6% |
5% |
||
| Santa Cruz |
2% |
3% | 2% | 2% | 3% | 3% | 3% |
3% |
||
| Giant |
18% |
24% | 15% | 20% | 12% | 17% | 11% |
16% |
||
| Momsen | ||||||||||
| Airborne |
3% |
2% | 3% | 2% | 4% | 3% | 3% |
2% |
||
| TREK |
4% |
4% | 4% | 3% | 5% | 5% | 7% |
6% |
||
| BMC |
1% |
1% | 1% | 0% | 1% |
1% |
||||
| Rocky Mountain |
2% |
1% | 1% | 1% | 1% | 1% | 1% |
0% |
||
| Merida | 8% | 10% | 8% | 10% | 8% |
10% |
||||
|
2012 Total |
2012 SA | 2013
Total |
2013
SA |
2014
Total |
2014
SA |
2015
Total |
2015
SA |
2016 Total |
2016 SA |
|
| Specialized |
23% |
21% | 23% | 23% | 29% | 30% | 35.6% | 40.4% | 36% |
35% |
| SCOTT |
11% |
12% | 11% | 12% | 15% | 17% | 13.6% | 13.8% | 12% |
12% |
| Cannondale |
7% |
7% | 7% | 7% | 10% | 10% | 8.7% | 7.3% | 10% |
11% |
| Santa Cruz |
5% |
5% | 5% | 5% | 3% | 4% | 4% | 5.8% | 5% |
7% |
| Giant |
11% |
13% | 11% | 13% | 6% | 7% | 3.6% | 5.8% | 4% |
5% |
| Momsen |
3% |
4% | 2% | 3.1% | 3% |
4% |
||||
| Airborne |
2% |
1% | 2% | 1% | 2% | 2% | 4.3% | 3.1% | 5% |
3% |
| TREK |
7% |
6% | 7% | 8% | 5% | 6% | 4% | 3.1% | 4% |
3% |
| BMC |
1% |
1% | 1% | 1% | 3% | 1% | 3.4% | 2.4% | 3% |
3% |
| Rocky Mountain |
1% |
1% | 1% | 1% | 2% | 2% | 2.2% | 2.8% | 2% |
3% |
| Merida |
5% |
6% | 5% | 4% | 4% | 5% | 3.4% | 3.4% | 1% |
1% |
Note: The information the Cape Epic sent to us in 2015 included decimal points, but that changed in 2016, back to round numbers.
From a South African market perspective, Cannondale was the biggest climber since the previous year (2105), rising 4% and Specialized the biggest loser, dropping to 5%. The biggest mystery for us remains Airborne. Collectively, nobody at TREAD knows anyone that owns an Airborne. But somehow this online-sales-only American brand with less than 10 employees has grown to 5% in total with 3% of the South African entrants riding them!
Hardtail vs Dual Suspension
| 2007 | 2008 | 2009 | 2010 | 2011 | 2012 | 2013 | 2014 | 2015 | 2016 | |
| Hardtail | 30% | 26% | 23% | 20% | 22% | 31% | 24% | 21% | 14% | 7.4% |
| Dual sus | 69% | 74% | 77% | 80% | 77% | 69% | 75% | 79% | 85% | 92.4% |
| Rigid | 0.2% |
This isn’t really a suprising statistic, although we’re not sure who would want to do the Cape Epic on a fully rigid frame… Note the dip in dual-sus growth in 2012/2013. This coincides with the introduction of 29-inch wheels, with most brands taking a while to perfect dual-suspension frame designs for the bigger hoops, which are now very common. The route has also changed in the past five years, becoming more and more suited to dual-sus bikes.
Wheel size
| 2011 | 2012 | 2013 | 2014 | 2015 | 2016 | |
| 26 inch | 78% | 36% | 17% | 8% | 6% | 5.3% |
| 29 inch | 22% | 64% | 82% | 90% | 91% | 92% |
| 27.5 inch (650b) | 0% | 0% | 1% | 2% | 3% | 2.4% |
| Fat bike | 0.3% |
We’ve test-ridden fat bikes (read here: Fatty BOOM) and vowed never to ride them again, other than on soft sand and in snow. We’re not sure if the handful that tackled the 2016 Cape Epic on a fat bike knew what they were getting themselves in for and wonder if they’ll recover fully before the 2017 event
Component split
| 2007 | 2008 | 2009 | 2010 | 2011 | 2012 | 2013 | 2014 | 2015 | 2016 | |
| Shimano | 61% | 57% | 57% | 47% | 46% | 45% | 51% | 50% | 44% | 44% |
| SRAM | 36% | 41% | 41% | 51% | 53% | 55% | 49% | 49% | 55% | 55% |
| Other | 3% | 2% | 2% | 2% | 1% | 0% | 0% | 1% | 1% | 1% |
SRAM remained dominant in 2016, but we reckon that may change this year after the introduction of Shimano’s 1×11 and 2×11 groupsets last year.
2016 Drivetrain configuration
Single chainring: 49%
Double chainring: 48%
Triple chainring: 3%
We suggested this stat be added into the questionnaire and find it interesting how many riders opted to go with a Single chainring. We think the Double will be more dominant this year, purely because of the increased options available now – and because it’s easier to pedal on the steep, rough gradients…
Bike brands of final GC top 10 2016:
1st Bulls
2nd Centurion
3rd TREK
4th Cannondale
5th ProTek
6th Cannondale
7th Bulls
8th TREK
9th Centurion
10th Canyon
For the first time since 2008, no Specialized in the overall top 10. Also conspicuously absent are other top-10 regulars, SCOTT and Merida.
GEAR STATS
Eyewear brands – most popular:
| 2012 | 2013 | 2014 | 2015 | 2016 | |
| Oakley | 36% | 40% | 45% | 49% | 51% |
| Rudy Project | 24% | 25% | 24% | 21% | 20% |
| adidas | 11% | 10% | 8% | 12% | 12% |
| Other | 29% | 25% | 23% | 18% | 17% |
Training aids
| 2007 | 2008 | 2009 | 2010 | 2011 | 2012 | 2013 | 2014 | 2015 | 2016 | |
| HRM | 85% | 85% | 84% | 86% | 82% | 83% | 84% | 84% | 86% | 86% |
| Power meter | 16% | 18% | 19% | 19% | 18% | 20% | 22% | 30% | 35% | 43% |
| GPS | N/A | 23% | 26% | 29% | 43% | 54% | 67% | 77% | 86% | 91% |
![]()
All rights reserved
*Originally published in TREAD Issue 40, 2016 and can be found on Zinio – All rights reserved