In Part 3 of our four-part reveal of the 2024 South African Mountain Biking Survey, presented by Garmin, we look at the responses to the performance questions. The 13 questions were designed to find out more about how mountain bikers measure their training/racing performance and which brands they choose for GPS devices, home trainers, workout apps and more.
Since this has tables, it’s best viewed on a laptop or desktop computer. On a mobile phone, turn to landscape for best viewing.
Do you wear a GPS smart watch to monitor your riding performance?
| 2024 | 2023 | 2022 | 2021 | 2020 | |
| Yes | 76.68% | 70.96% | 68.70% | 71.44% | 63.14% |
| No | 23.32% | 29.04% | 31.30% | 28.56% | 36.86% |
Due to their convenience and the fact that they offer so many cycling-specific features, GPS smart watches continue to grow in popularity. They’re also ‘lifestyle-measuring’ devices, offering stats on sleep quality, weather and recovery – and they tell the time, like a regular watch.
If yes, what brand do you currently use?
| 2024 | 2023 | 2022 | 2021 | 2020 | |
|---|---|---|---|---|---|
| Garmin | 79.63% | 76.75% | 76.90% | 74.05% | 70.86% |
| Apple Watch | 6.32% | 6.21% | 6.51% | 7.62% | 7.50% |
| Samsung | 3.53% | 3.13% | 2.09% | 2.55% | 3.41% |
| Suunto | 2.95% | 4.00% | 4.97% | 5.27% | 6.49% |
| Polar | 2.54% | 4.00% | 3.42% | 4.29% | 5.43% |
| Huawei | 1.56% | 1.46% | 2.09% | 2.04% | 1.96% |
| Wahoo | 0.47% | 1.06% | 0.60% | 0.87% | 0.33% |
| Other | 3.01% | 3.34% | 2.48% | 2.04% | 2.29% |
Garmin continues to dominates this category. But it’s not surprising since the brand has so many models that suit mountain bikers, including Fenix, Vivoactive, Forerunner and Enduro.
Do you use a traditional non-GPS cycling computer or a GPS cycling computer to measure your performance whilst you ride (that's mounted to your handlebar)?
| 2024 | 2023 | 2022 | 2021 | 2020 | |
|---|---|---|---|---|---|
| A traditional non-GPS computer | 4.87% | 5.50% | 5.20% | 6.62% | 9.30% |
| A GPS cycling computer | 65.43% | 65.04% | 64.37% | 61.95% | 54.56% |
| Neither | 29.71% | 29.46% | 30.43% | 31.43% | 36.13% |
Not much change here. The 29.71% that said ‘neither’, are likely using a cycling-aligned smart watch, which measures most of what a handlebar-mounted device measures, as well as off-the-bike measurement, such as sleep, recovery and other activities.
If yes, what brand and model do you currently use?
| Cycling GPS brand | 2024 | 2023 | 2022 | 2021 | 2020 |
|---|---|---|---|---|---|
| Garmin | 78.85% | 75.32% | 77.39% | 72.93% | 71.53% |
| Wahoo | 6.05% | 8.16% | 6.19% | 7.42% | 6.48% |
| Xoss | 3.62% | 2.87% | 2.38% | – | – |
| Cateye | 1.92% | 1.59% | 1.85% | 2.76% | 2.76% |
| Polar | 1.36% | 2.17% | 2.11% | 3.38% | 2.76% |
| Ryder | 0.96% | 0.96% | 1.58% | 1.94% | 1.35% |
| Lezyne | 0.96% | 0.77% | 1.16% | 1.64% | 1.94% |
| Sigma | 0.79% | 1.02% | 1.27% | 1.69% | 1.82% |
| Giant | 0.62% | 0.89% | 1.79% | 1.94% | 1.88% |
| Bryton | 0.45% | 0.77% | 1.21% | 1.59% | 3.12% |
| Other | 4.41% | 5.48% | 2.96% | 4.71% | 6.36% |
Garmin has increased its dominance further, but it is the brand that created the cycling GPS category in the early 2000s and its expanding Edge range is cycling-specific.
Which data metrics are most important to you?
| 2024 | 2023 | 2022 | 2021 | 2020 | |
|---|---|---|---|---|---|
| Distance, speed & time | 91.71% | 92.32% | 93.04% | 92.95% | 93.08% |
| Heart rate | 81.44% | 81.66% | 82.72% | 82.57% | 80.03% |
| Average speed | 58.75% | 57.66% | 57.24% | 54.58% | 56.62% |
| Accumulated ascent | 49.23% | 47.30% | 46.00% | 44.35% | 43.27% |
| Time of day | 32.91% | 30.92% | 36.95% | 29.99% | 31.80% |
| Cadence | 30.58% | 30.57% | 33.76% | 32.98% | 29.03% |
| Calories burned | 21.98% | 22.44% | 27.80% | 28.49% | 27.96% |
| Navigation capabilities | 28.57% | 25.57% | 30.08% | 25.58% | 25.00% |
| Elevation above sea level | 13.73% | 12.53% | 23.60% | 21.45% | 21.63% |
| Slope gradient | 22.51% | 22.18% | 21.28% | 19.72% | 17.71% |
| Power metrics | 26.11% | 22.84% | 22.88% | 21.52% | 16.42% |
| Air temperature | 17.81% | 17.08% | 17.60% | 15.13% | 16.16% |
| Smart notifications | 13.82% | 12.63% | 15.60% | 13.10% | 14.64% |
| Advanced physiological metrics (VO2 max, training effect etc) | 15.62% | 13.41% | 13.56% | 13.14% | 10.95% |
| Safety features | 16.41% | 14.40% | 16.48% | 12.14% | 10.50% |
| Training plans & workouts | 16.59% | 13.63% | 14.60% | 11.95% | 10.02% |
| Motor vehicle sensor (Garmin Varia | 11.53% | 10.46% | _ | _ | _ |
| All of the above | 9.17% | 6.82% | 9.24% | 8.50% | 8.65% |
Survey-takers could choose as many as they felt necessary. This does give an indication what the priority features are on cycling-specific devices for South African mountain bikers.
Do you use a Garmin Varia Radar to warn you of motor vehicles approaching from behind?
| 2024 | 2023 | 2022 | 2021 | |
|---|---|---|---|---|
| Yes | 14.98% | 11.84% | 8.94% | 6.29% |
| No | 81.75% | 83.13% | 88.27% | 91.58% |
| I ride with others that have it and I connect to theirs | 2.58% | 3.67% | 2.19% | 1.32% |
| Other | 0.70% | 1.36% | 0.60% | 0.81% |
Having more than doubled since 2021, The Garmin Varia Radar is an impressive safety device for those who share roads with motor vehicles. With the low safety standards on our roads this figure will continue to rise every year.
Do you currently use a power meter?
| 2024 | 2023 | 2022 | 2021 | 2020 | |
|---|---|---|---|---|---|
| Yes | 23.65% | 21.38% | 17.99% | 14.41% | 12.69% |
| No | 76.35% | 78.62% | 82.01% | 85.59% | 87.31% |
Another unsurprising increase. Power measurement is the best way to effectively measure cycling performance and the range of power meter options is increasing and becoming more affordable.
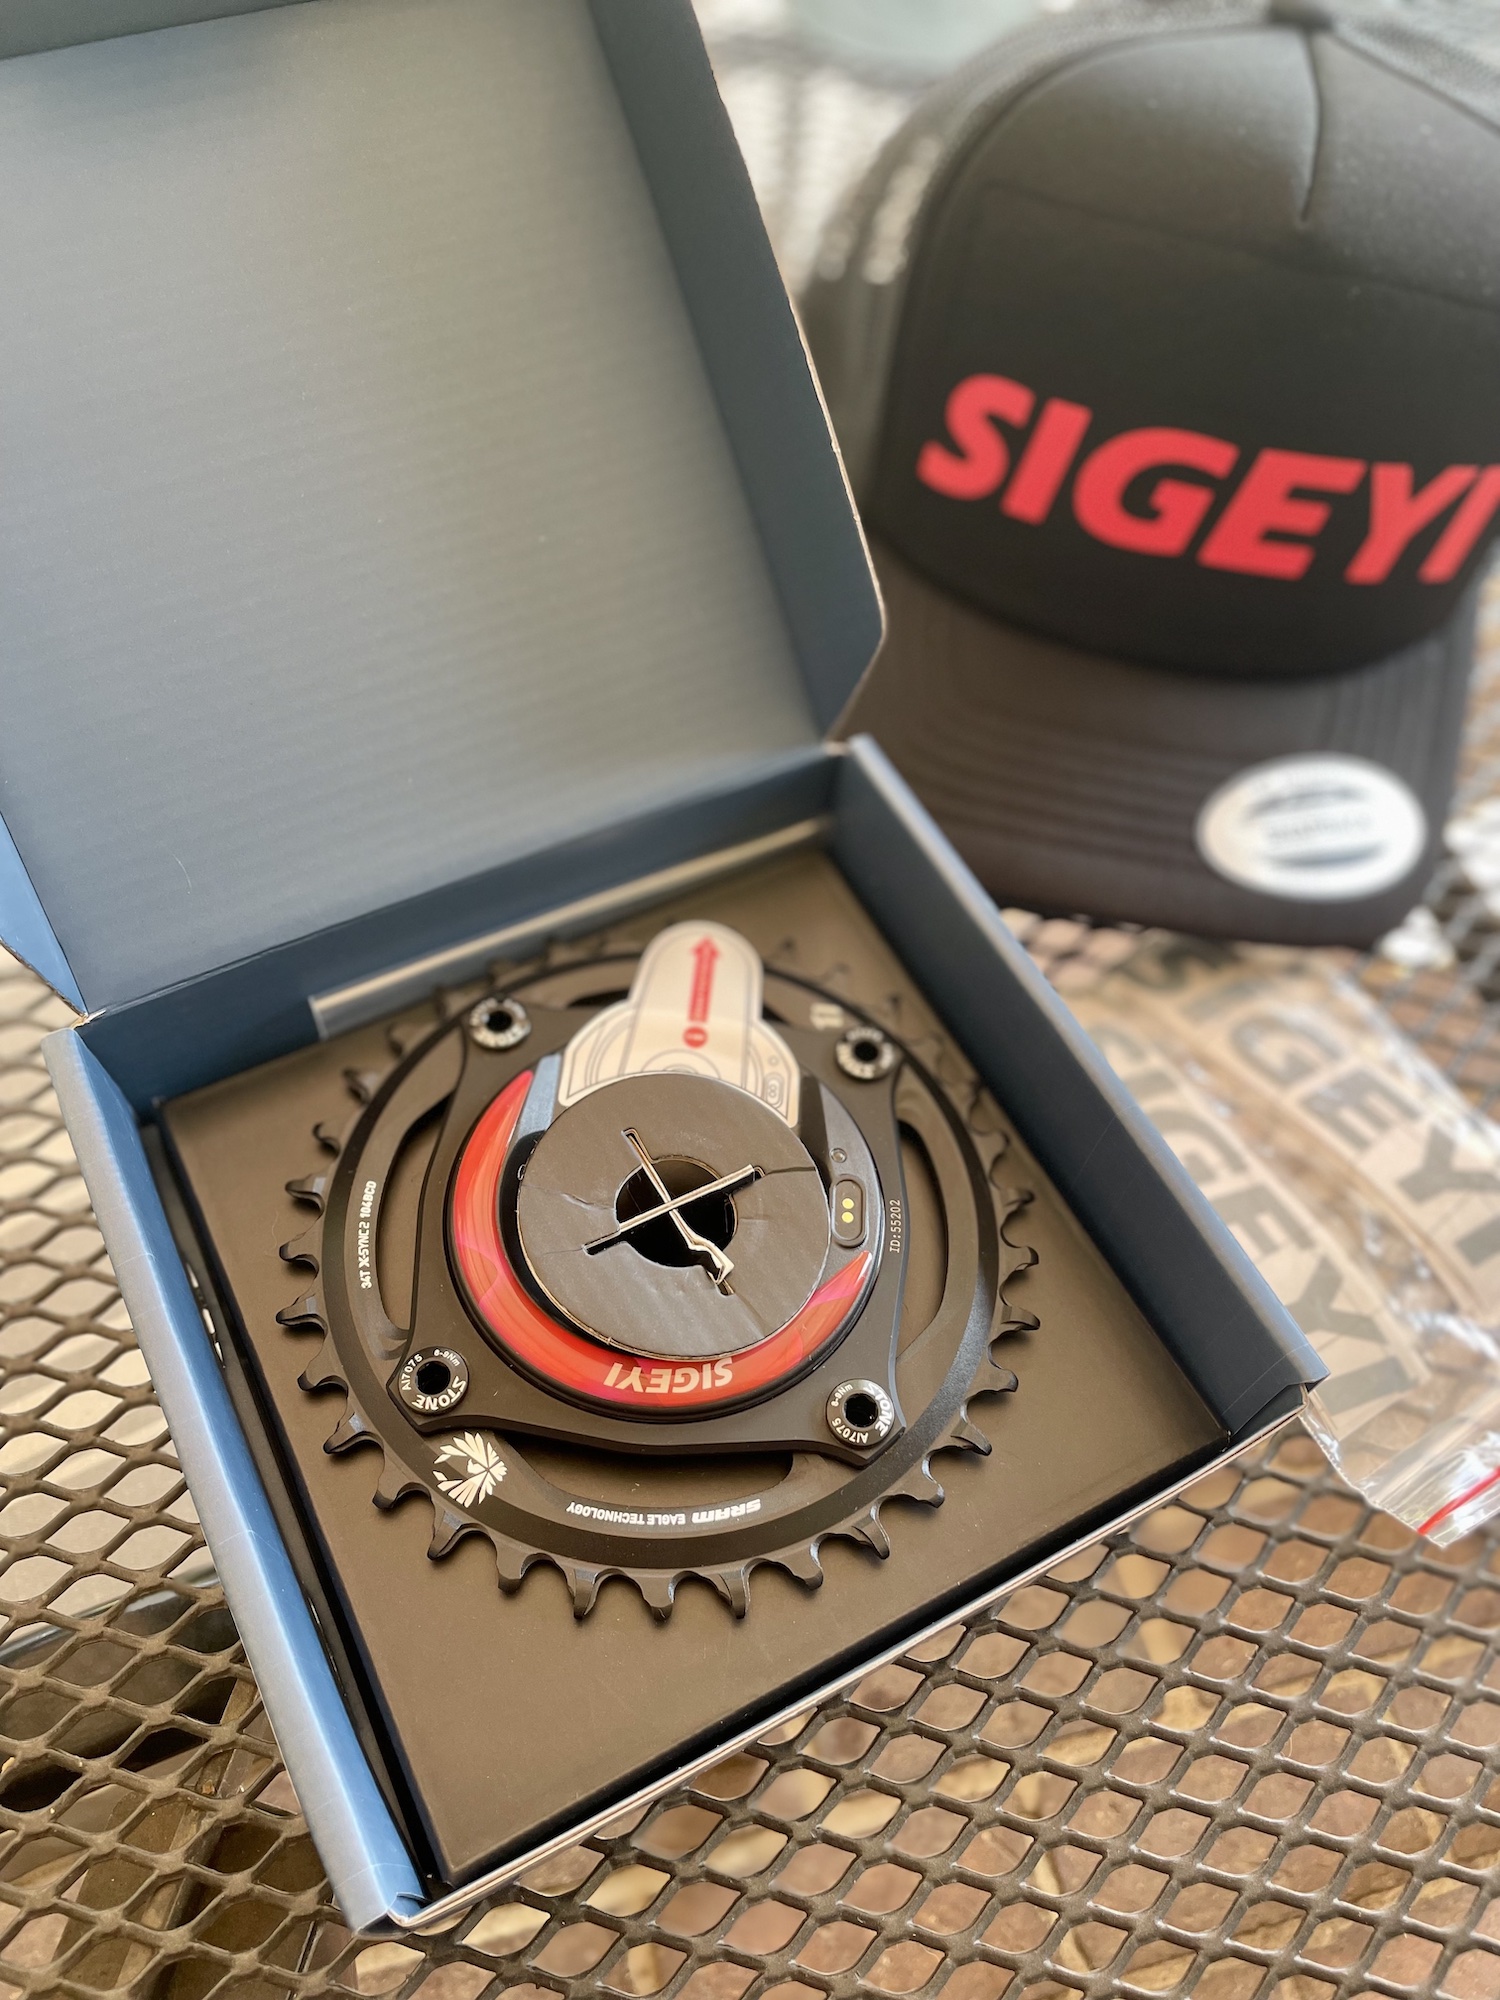
If you use a power meter, what brand to you use?
| 2024 | 2023 | 2022 | |
|---|---|---|---|
| Quarq | 23.37% | 21.37% | 20.24% |
| Power2Max | 17.93% | 21.37% | 18.53% |
| Garmin Rally | 14.59% | 15.42% | 13.90% |
| Sigeyi AXO | 12.83% | 9.47% | 4.87% |
| Stages | 9.14% | 12.56% | 19.51% |
| Favero Assioma | 8.44% | 4.63% | 5.14% |
| 4iiii | 3.51% | 4.19% | 6.09% |
| Xcadey | 3.34% | 5.73% | 2.92% |
| Specialized Power Crank | 2.11% | 1.32% | 0.48% |
| SRM | 1.05% | 0.66% | 0.24% |
| Giant Power Pro | 1.05% | – | 0.48% |
| Rotor | 0.88% | 1.32% | 2.19% |
| Cyclops Power Tap | 0.88% | 1.10% | 2.92% |
| Magene | 0.53% | – | 0.24% |
| Shimano Force Vector | 0.18% | 0.22% | 1.70% |
| RaceFace Cinch | 0.18% | 0.22% | 0.24% |
| Velocomp Power Pod | – | 0.24% |
After leading along with Power2Max the previous year, Quark now leads on its own, with Power2Max losing some market share, but maintaining second spot. Sigeyi AXO and Favero Assioma both enjoyed notable increases in market share.
Do you train indoors to achieve cycling fitness/strength?
| 2024 | 2023 | 2022 | 2021 | 2020 | 2019 | |
|---|---|---|---|---|---|---|
| Yes, mostly on my home trainer | 49.84% | 46.99% | 48.23% | 49.62% | 43.85% | 35.11% |
| Yes, mostly at a power-training studio | 2.21% | 2.91% | 2.64% | 2.51% | 2.42% | 5.91% |
| Yes, mostly on the power-measured bike at my gym | 10.97% | 10.01% | 10.29% | 10.11% | 10.10% | 22.03% |
| No | 36.99% | 40.08% | 38.84% | 37.76% | 43.64% | 36.96% |
Home training enjoyed a small increase in the past year.
If you use a home trainer, which do you have?
| 2024 | 2023 | 2022 | 2021 | 2020 | 2019 | |
|---|---|---|---|---|---|---|
| Basic manual resistance trainer | 19.66% | 23.73% | 27.00% | 35.64% | 48.19% | 42.70% |
| Smart trainer | 80.34% | 77.27% | 73.00% | 64.36% | 51.81% | 57.30% |
The popularity of Smart Trainers continues to rise, which is not surprising. The difference between the two types is like night and day.
If you use a home trainer, which brand and model do you have?
| 2024 | 2023 | 2022 | 2021 | 2020 | 2019 | |
|---|---|---|---|---|---|---|
| Wahoo | 48.57% | 48.87% | 42.28% | 38.19% | 33.54% | 39.46% |
| Tacx | 21.81% | 20.16% | 20.46% | 19.99% | 18.29% | 17.01% |
| Elite | 6.34% | 6.19% | 7.36% | 6.64% | 6.65% | 3.40% |
| Saris/CycleOps | 4.32% | 5.52% | 6.06% | 6.70% | 7.56% | 9.98% |
| Wattbike | 3.55% | 3.68% | 3.32% | 2.12% | 1.93% | 3.40% |
| Giant | 3.28% | 4.51% | 5.99% | 9.55% | 13.31% | 11.34% |
| Trojan | 2.86% | 2.76% | 3.91% | 4.30% | 2.58% | 3.85% |
| Spinning bike | 2.79% | 3.09% | 3.00% | 4.63% | 1.42% | 0.91% |
| Raleigh | 1.25% | 1.42% | 1.89% | 3.85% | 1.80% | 1.59% |
| Other/Unknown | 5.23% | 3.76% | 5.73% | 4.02% | 12.15% | 7.93.% |
No real changes here with Wahoo holding its top spot by quite a margin.
Whilst on your home trainer, do you use a cycling training/workout app?
| 2024 | 2023 | 2022 | 2021 | 2020 | |
|---|---|---|---|---|---|
| Yes | 69.77% | 65.74% | 63.57% | 60.04% | 46.78% |
| No | 30.23% | 34.26% | 36.43% | 39.96% | 53.22% |
Home trainer apps are highly engaging and really great for motivation and even competition. It’s not really surprising that they’re increasing in popularity.
If you use a cycling training/workout app, which do you use?
| 2024 | 2023 | 2022 | 2021 | 2020 | |
|---|---|---|---|---|---|
| Zwift | 46.41% | 63.85% | 62.67% | 70.42% | 66.70% |
| My Whoosh | 12.33% | 2.20% | – | – | – |
| Training Peaks | 9.34% | 1.05% | – | – | – |
| Rouvy | 7.32% | 7.09% | 6.37% | 7.19% | 7.41% |
| Wattbike | 6.35% | 6.71% | 7.99% | 1.25% | 1.71% |
| Tacx Training | 4.04% | 4.41% | 3.69% | 3.86% | 3.49% |
| Wahoo | 3.81% | 4.12% | 4.07% | 0.66% | 0.70% |
| TrainerRoad | 2.91% | 3.83% | 4.22% | 5.37% | 4.18% |
| The Sufferfest | 0.82% | 1.15% | 1.46% | 3.93% | 3.49% |
| FullGaz | 0.52% | 0.95% | 0.77% | 0.91% | 0.87% |
| Xert | 0.22% | 0.19% | – | – | – |
| Golden Cheetah | 0.22% | 0.09% | 0.38% | 0.23% | 0.26% |
| BKool Simulator | 0.22% | 0.09% | 0.23% | 0.08% | 0.26% |
| Peloton | 0.22% | 0.09% | – | – | – |
| Shimano Connect | 0.15% | 0.09% | – | – | – |
| Kinetic Fit | 0.07% | 0.09% | 0.15% | 0.08% | 0.70% |
| Motosumo | 0.07% | 0.28% | – | – | – |
| Think Rider | 0.07% | 0.09% | – | – | – |
| RGT Cycling | – | 0.47% | 1.61% | 0.76% | 0.61% |
| Kino Map | – | 0.09% | – | – | – |
| Morpheus | – | 0.09% | – | – | – |
| Other | 4.86% | 3.8% | 6.30% | 5.26% | 9.62% |
Zwift still holds its top spot, but My Whoosh and Training Peaks grabbed chunks of market share in the past year.
Did you miss Parts 1 and 2 of our four-part reveal of the 2024 South African Mountain Biking Survey, presented by Garmin? Check them out here:
Part 1 – Rider stats
Part 2 – Bike stats